The basic principle of fluorescence microscopy is the highly specific visualization of cellular components with the aid of fluorescent dyes. This may be a fluorescent protein that is genetically related to the protein of interest, such as green fluorescent protein (GFP). If cloning is not possible, such as on histological samples, another technique such as immunofluorescence staining is required to visualize the protein of interest. For this purpose, antibodies are used to link different fluorescent dyes and bind them directly or indirectly to appropriate targets. In addition, with fluorescent dyes, the application of fluorescence microscopy is no longer limited to protein observation, but can also stain nucleic acids, polysaccharides and other structures, and even non-biological substances such as calcium ions can be detected. This article introduces several commonly used fluorescent dyes.
Immunofluorescence
There are two ways to visualize the protein of interest under a fluorescence microscope. A fluorescent protein can be genetically linked to a target protein by means of an intrinsic fluorescent signal, that is, by cloning; or it can be specifically bound to a protein of interest by means of fluorescently labeled antibodies. For some biological problems, the latter is more practical and even more necessary. For example, in the case of histological samples, usually the samples are from organisms that do not contain any fluorescent proteins, so it is not possible to use fluorescent proteins. Furthermore, if functional antibodies are available, immunofluorescence is much faster than fluorescent protein techniques because the fluorescent protein method must clone the gene of interest and transfect the DNA into the corresponding cells. Another disadvantage of fluorescent proteins is that they are proteins themselves. As a result, specific protein properties are built into the cell, which may lead to dysfunction or interference with the bound protein of interest. Of course, it’s worth noting that fluorescent proteins are often the method of choice for viewing living cells.
Immunofluorescence exploits the specific binding affinity of an antibody to an antigen. Two different structures can exist here. The simplest method is to use a fluorescently labeled antibody that binds to the protein of interest, called direct immunofluorescence.
Two forms of the antibody are used in most cases. The 1st antibody binds to the target protein, and itself (1st antibody) is not fluorescently labeled. However, the second antibody (2nd antibody) that binds to the first antibody specifically carries a fluorescent dye, and this method is called indirect immunofluorescence. Indirect immunofluorescence has several advantages. On the one hand, there is an amplification effect because more than one secondary antibody binds to one primary antibody. On the other hand, for your protein of interest, it is not necessary to always label each antibody with a fluorescent dye, and a commercially available fluorescently labeled secondary antibody can be used. The widely used fluorescent dyes in immunofluorescence are FITC, TRITC or several of the Alexa Fluor dyes mentioned below.
FITC and TRITC
Fluorescein isothiocyanate (FITC) is an organic fluorescent dye that is still used in immunofluorescence and flow cytometry. The dye exhibits excitation/emission peaks at 495/517 nm and can be conjugated to different antibodies via its reactive isothiocyanate group binding to amino, sulfhydryl, imidazolyl, tyrosyl or carbonyl groups on proteins . Its basic structure, that is, the molecular weight of fluorescent yellow is 332g/mol, and it is often used as a fluorescent tracer. FITC (389 g/mol) was one of the first dyes used in fluorescence microscopy and is the source of fluorescent dyes such as Alexa-fluor488. Its fluorescent activity originates from its own large conjugated aromatic electronic structure, which is excited by light in the blue spectrum.
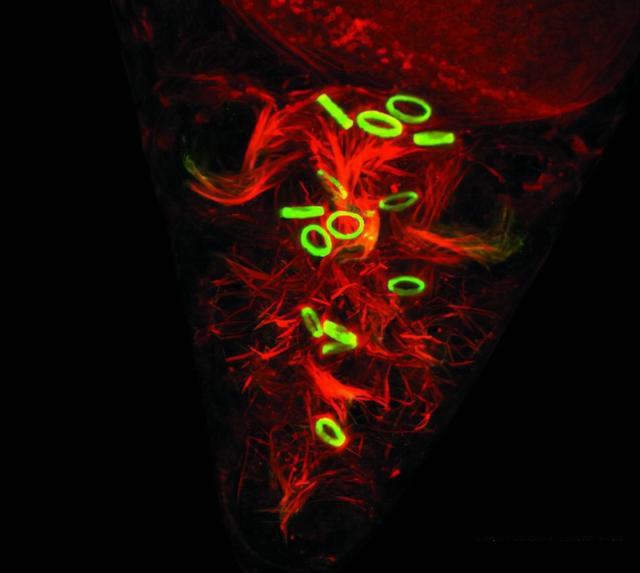
Figure 1: Drosophila embryonic development, green: FITC, red: TRITC.
One dye often used with FITC is the same class of TRITC (tetramethylrhodamine-5-(and 6)-isothiocyanate). Unlike FITC, TRITC is not fluorescein, but a rhodamine series derivative. Rhodamine also has a large conjugated aromatic electronic structure, so it can fluoresce. Unlike FITC, TRITC (479 g/mol) is excited in the green spectrum with a maximum at 550 nm and a maximum emission wavelength of 573 nm. Binding to proteins such as antibodies is also based on reactive isothiocyanate groups.
Even though FITC and TRITC are still used, they are not recommended for state-of-the-art microscopy considering that they are fairly weak fluorescent dyes. The main advantage of both is the low cost.
Anthocyanin
This relatively small collection of fluorescent dyes is derived from anthocyanins and hence the names: Cy2, Cy3, Cy5, and Cy7. All of these dyes can be attached to nucleic acids or proteins through reactive groups. For example, protein labels use maleamide groups. Interestingly, Cy5 is sensitive to the surrounding electronic environment in terms of fluorescence, which can be used for enzymatic assays. The conformational changes of the cohesin lead to positive and negative changes in fluorescence emission. In addition, Cy3 and Cy5 can be used in FRET experiments. Anthocyanin dyes are relatively old fluorescent dyes and the basis of other fluorescent dyes. They have the advantages of high brightness, good photostability, and high quantum efficiency.
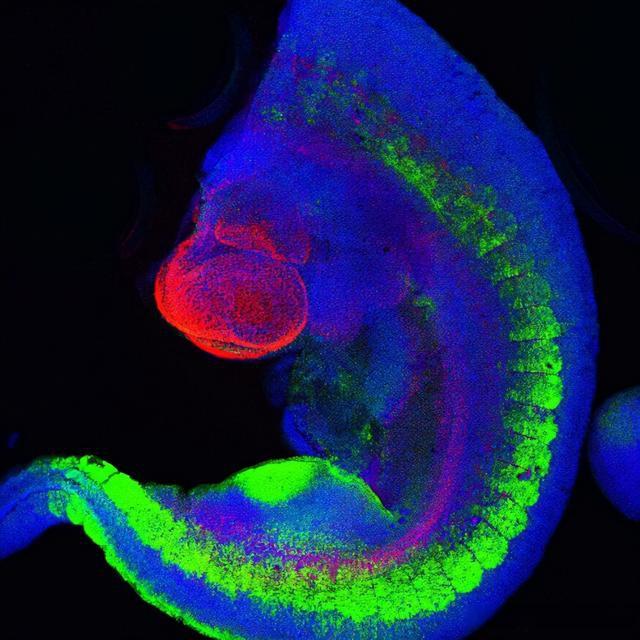
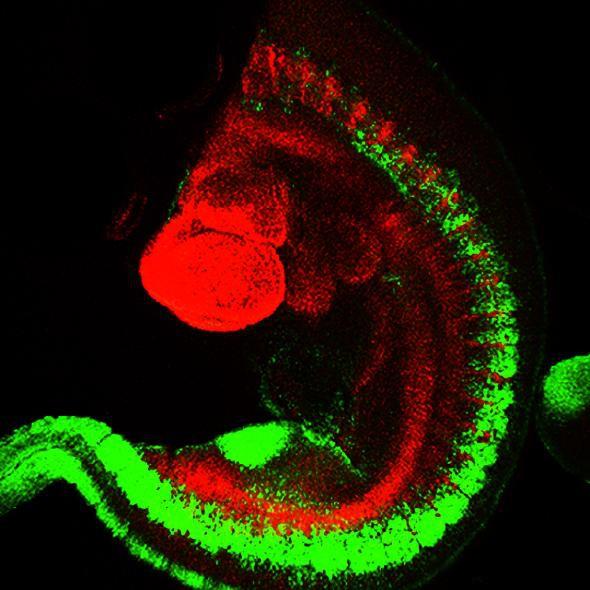
Figure 2: Mouse transgenic embryos, inter-limb segments, 5 inter-limb segments of E10.5 mouse transgenic embryos: EpaxialMyf5 eGFP; GFP-Alexa 488 immunohistochemical staining; embryonic muscle fibers stained with Desmin-Cy3 , nuclei revealed with Hoechst, top-to-bottom dimensions: 3.5 mm (a), 800 μm (b). Sample provided by: Aurélie Jory, Imaging Centre, Institute for Stem Cells and Development and Institute of Genetics and Molecular Cell Biology (IGBMC), Institut Pasteur, Paris, France.
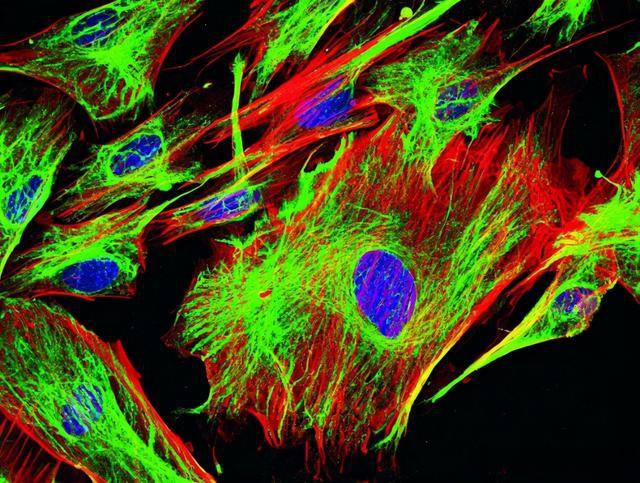
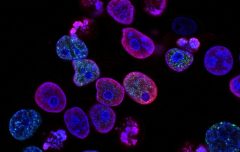
Figure 3: Mouse fibroblasts, green: F-Actin, FITC, red: Tubulin, Cy5, blue: nucleus, DAPI. Sample provided by: Dr. Günter Giese, Max-Planck Institute for Medical Research, Heidelberg, Germany.
DNA staining treatment
In fluorescence microscopy, not only protein structures are of interest, but also nucleic acids. It is sometimes necessary to determine the exact location or number of cells by examining the nucleus. One of the most common DNA stains is DAPI (4′,6-diamino-2-phenylindole), which binds primarily to A-T-rich regions of the DNA double helix. The fluorescence intensity of DAPI on DNA increased compared to the unbound state. The dye is excited by UV (ultraviolet) light with a maximum excitation wavelength of 358nm. The emission spectrum is broad with a peak at 461 nm. Weak fluorescence can also detect RNA binding. In this case, the emission is shifted to 500 nm. Interestingly, DAPI is able to penetrate the intact cell membrane. Therefore, the dye can be used for both fixed and living cells.
The second widely used DNA staining method is Hoechst dye, originally produced by the chemical company Hoechst AG. Hoechst 33258, Hoechst 33342, and Hoechst 34580 are all phthalimides that have a tendency to intercalate into A-T rich regions, so the latter is not commonly used. Similar to DAPI, these dyes are UV excited and emit a maximum at 455 nm, which becomes 510–540 nm in the unbound state. Hoechst dyes are also cell permeable and can therefore be used for fixed and live cells. Unlike DAPI, Hoechst dyes are less toxic.
The DNA stain propidium iodide cannot penetrate cell membranes. In cell culture, this stain is often used to differentiate between live and dead cells because it cannot enter intact cells. Propidium iodide is also a binding agent, but not specific for different bases. In the nucleic acid-binding state, its maximum excitation wavelength is 538 nm, and its maximum emission wavelength is 617 nm. The excitation and emission maxima of propidium iodide in the unbound state are shifted to shorter wavelengths and weaker intensities. It can also bind to RNA without changing its fluorescent properties. To differentiate between DNA and RNA, sufficient polymerase must be used.
Acridine Orange is a dye that can differentiate between DNA and RNA without prior manipulation. Its maximum excitation/emission pair is 502nm/525nm in the DNA-bound state and 460nm/650nm in the RNA-bound state. In addition, the dye can also enter into acidic compartments such as lysosomes. Cationic dyes are protonated in the acidic compartment. In acidic environments, acridine orange is excited by light in the blue spectrum, with the strongest emission in the orange region. Because apoptotic cells have many acidic compartments that are phagocytosed, this dye is also a common marker for these cells.
Compartment and organelle-specific dyes
Under fluorescence microscopy, it is often reasonable to stain cellular compartments such as lysosomes or endosomes and organelles such as mitochondria. For this purpose, a specific set of dye combinations will be introduced in this section.
A well-established way to look at mitochondria is to use the MitoTracker. This is a cell permeable dye with mild thiol-reactive chloromethyl moieties. The dye can bind covalently to matrix proteins by reacting with the free sulfhydryl groups of cysteine residues. MitoTracker is available in different colors and modified ingredients (see Table 1) and is also a trademark of Molecular Probes. Unlike traditional mitochondria-specific stains such as rhodamine 123 or tetramethylrostamine, MitoTracker is not washed out after disrupting the membrane potential with fixatives.
According to mitochondrial staining, there are also dyes to label acidic compartments such as lysosomes, which are called LysoTracker. These are membrane permeable weak bases attached to fluorophores. These bases are likely to have affinity for the acidic compartment due to protonation. LysoTracker is also available in different colors (see Table 1).
Compartments similar to lysosomes are fungal vacuoles, such as Saccharomyces cerevisiae. The space enclosed by this film is also acidic. One of the ways to see it under a fluorescence microscope is to use styryl dyes such as FM 4-64 or FM 5-95.
In terms of protein secretion experiments, the endoplasmic reticulum (ER) is particularly noteworthy. A classic dye for staining this compartment is DiOC6(3). This dye, although preferentially bound to the endoplasmic reticulum, can also bind to other membranes such as mitochondrial membranes. Another way to specifically stain ER is to use ER-Trackers, such as the green and red ER-Trackers. Both dyes are BODIPY-based dyes related to glyburide, a sulfonylurea enzyme, that bind to ATP-sensitive potassium channels characteristic of the ER membrane. BODIPY (borodipyrrole methyl) describes a group of relatively pH-insensitive dyes that are virtually insoluble in water. These dyes are not very good tools for protein labeling, but they work well for lipid and membrane labeling.
The ER-proximal compartment – the Golgi apparatus – can be labeled with fluorescent ceramide analogs such as NBD C6-Ceramide and BODIPY FL C5-Ceramide. Ceramides are sphingolipids abundant in the Golgi apparatus.
With the help of further lipid-based dyes it is also possible to stain specific membrane regions such as lipid rafts. These cholesterol-rich domains can be visualized using NBD-6 cholesterol or NBP-12 cholesterol, etc. (Avanti polar lipids).
In addition to labeling the intercellular compartment with special non-protein fluorescent dyes, regions of interest can also be stained with the help of proteins that have a preference for different locations in the cell. These proteins can be attached to fluorescent dyes and visualized under a fluorescence microscope. An example of this approach is the use of wheat germ agglutinin (WGA), which specifically binds to sialic acid and N-acetylglucosamine groups present in the plasma membrane. WGA is coupled to a fluorescent dye. With it the plasma membrane can be observed.
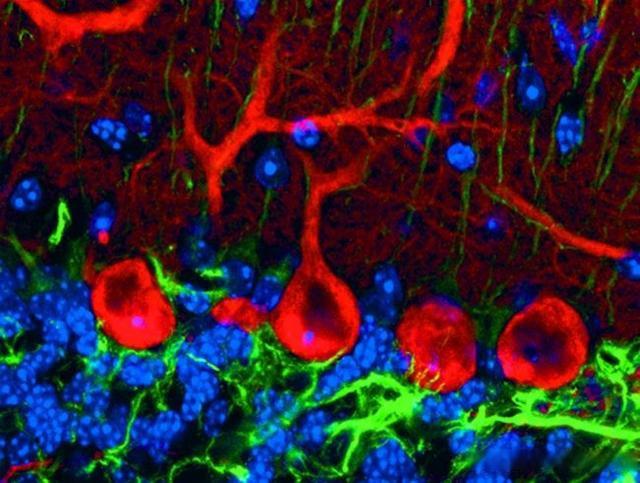
Figure 4: Pukinje cells, tricolor labeled sagittal section of mouse cerebellar cortex. Red: anti-calbindin-D28k/Cy3, Green: anti-GFAP/Cy5, Blue: Hoechst 33258
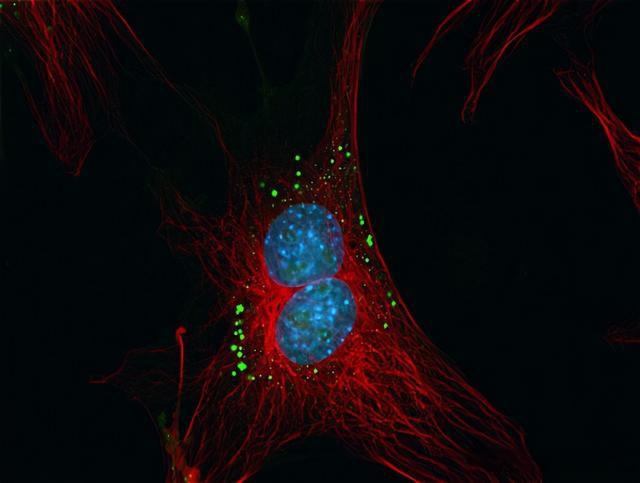
Figure 5: Bovine lung endothelial cells. Red: MitoTracker Red CMXRos-labeled mitochondria, green: green fluorescent BODIPY FL phallacidin-labeled fibrillar actin, blue: DAPI-labeled nuclei. This image uses a 3D blind deconvolution method to improve image quality
The ER-proximal compartment – the Golgi apparatus – can be labeled with fluorescent ceramide analogs such as NBD C6-Ceramide and BODIPY FL C5-Ceramide. Ceramides are sphingolipids abundant in the Golgi apparatus.
Special membrane regions such as lipid rafts can also be stained with the help of other lipid-based dyes. These cholesterol-rich domains can be visualized using NBD-6 cholesterol or NBP-12 cholesterol, etc. (Avanti polar lipids).
Regions of interest can also be stained with proteins that have a preference for different locations in the cell. An example of this approach is the use of wheat germ agglutinin (WGA), which specifically binds to sialic acid and N-acetylglucosamine groups present in the plasma membrane.
Functional experiment
“Functional assays” is an umbrella term that refers to standardized experiments that assess various functions that can be visualized with fluorescent markers. These markers include, but are not limited to, any of the labeling techniques and fluorophores described above. For many of these functional experiments, staining kits are commercially available and can be easily used on a variety of samples. An example of a functional assay is the well-known and widely used live/dead cell assay. Two fluorophores were used to label live and dead cells, respectively. With both values in hand, the overall health of the cell can be assessed. Correlating this information with other markers can also improve understanding of the underlying processes.
Fluorescent Dyes and Their Excitation and Emission Wavelength Peaks
All the dyes mentioned above are listed in the table below. In addition, other fluorescent dyes and their excitation and emission wavelength peaks are mentioned in the table.
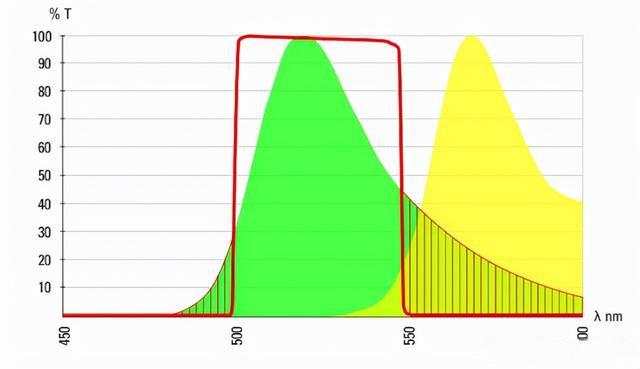
Figure 6: Fluorescence emission curves of Alexa 488 (green curve) and Alexa 555 (yellow curve). The overlap of the two emission spectra is evident. The red line represents the bandpass of the 488 emission filter.